See also
Resuscitation: Care of the seriously unwell child
Recognition of the seriously unwell neonate and young infant
Supraventricular Tachycardia
Key Points
- Use a systematic approach for accurate interpretation of paediatric ECGs
- Always interpret an ECG within the clinical scenario (history and examination findings, known cardiac diagnosis)
- The age-specific limits of normal are an essential tool for accurate assessment
- A senior clinician should always review abnormal findings on an ECG
- Discuss all children presenting with any cardiac ‘red flags’ with a senior clinician, even if an ECG appears normal. Further investigation including 24-hour ECG, echocardiogram or exercise tolerance test may be required
Background
- The aim of this guideline is to provide clinicians with a systematic approach to basic paediatric ECG interpretation. The guideline highlights common ECG abnormalities in important cardiac pathologies and
electrolyte abnormalities
- Common indications for performing an ECG include
chest pain,
syncope, palpitations,
cyanotic episodes spells,
seizures or ‘funny turns’,
drug ingestion, abnormal cardiac examination,
electrolyte abnormalities or a family history of sudden death or life-threatening event
- Many ECG characteristics vary with age
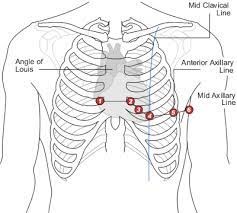
- If abnormal ECG changes are out of keeping with clinical features, check ECG lead placement (see Additional notes) and consider repeat ECG
- Modern ECG machines may calculate intervals, durations and axes. These should be seen as a guide and not relied upon. Manual calculation is recommended
- Any child presenting with cardiac ‘red flags’ (including exertional chest pain or syncope, poor exercise tolerance, palpitations, family history of early cardiac death, arrythmia or sudden death) and/or abnormal findings on cardiac examination should be discussed with a senior clinician
A stepwise approach to basic interpretation of a paediatric ECG
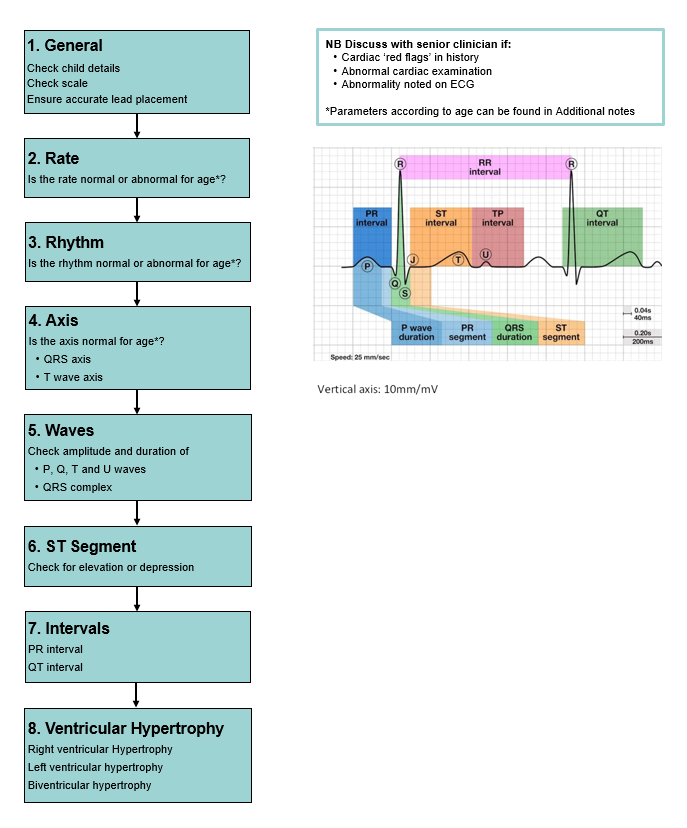
General
- Check the patient details on the ECG to ensure it is the correct child
- The scale of the ECG is generally (by default) set at 25 mm/second on the x-axis and 10 mm/mV on the y-axis. All calculations depend on the scale, it is important to check this prior to interpretation. If set at this scale, one small square (1 mm) = 0.04 seconds and 1 large square (5 mm) = 0.2 seconds
Rate
- Is the rate normal or abnormal for age? (see Additional notes for range by age)
- An estimate of the heart rate can be obtained by dividing 300 by the number of large squares between R waves
- Tachycardia: Consider sinus tachycardia, supraventricular tachycardia, ventricular tachycardia, atrial fibrillation, atrial flutter
- Bradycardia: Consider sinus bradycardia, nodal rhythm, atrioventricular block
Rhythm
- Is the rhythm normal or abnormal?
- ‘Sinus rhythm’ implies that the sinoatrial (SA) node is acting as the pacemaker for the heart. To be interpreted as ‘normal sinus rhythm’ the following criteria must be met:
- Normal rate for age
- P wave in front of every QRS complex
- P wave axis must be in the range of 0 to +900 (To meet this criterion the P wave should be upright in leads II, III and aVF)
- Normal P wave morphology
- Normal PR interval
- Sinus arrythmia: Normal finding, irregular rate (variation of R-R ratio is >0.12 seconds)
- Sinus tachycardia: Consider
sepsis, shock, hyperthyroidism, medication
- Sinus bradycardia: Consider raised intracranial pressure, medication, sedation,
sleep
Axis
QRS Axis
- Is the axis normal or abnormal for age? (see Additional notes for ranges by age)
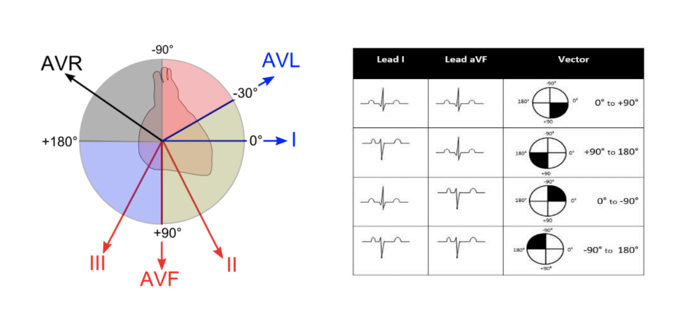
- The limb lead vectors determine the axis
- A positive QRS complex in leads I and aVF results in an axis of 0 to +900 (normal in older children and adults)
- Left axis deviation (LAD): -30 to -900. Consistent with atrioventricular septal defect (AVSD), left ventricular hypertrophy (LVH), tricuspid atresia. Mild LAD (-300) is normal from adolescence
- Right axis deviation (RAD): +90 to +1800. In older children, RAD can be caused by right ventricular hypertrophy (RVH)
- Superior axis deviation (North-West Axis): -90 to +1800. Consistent with AVSD, tricuspid atresia, Ebstein anomaly, Wolff-Parkinson-White (WPW), dextrocardia
T Wave Axis
- In the first 2-3 days of life, upright T waves in the right precordial leads (V1 and V3R) are normal
- It is usual for the T waves in these leads to invert in the majority of infants during the first week of life. Persistence of a positive T wave in V1 or V3R beyond the first week of life should raise suspicion of abnormality, usually RVH
- In the intermediate leads (V2 and V3), T wave is often inverted in early childhood and there is progression to the T wave becoming upright in sequence V3, V2, V1 during adolescence
- T wave in V5 and V6 should be upright at all ages, inversion suggests LVH
P wave
- P waves are normally upright in I and aVF
- P wave amplitude should be
<3 mm (3 small squares)
- The maximum P wave duration is
<0.10 seconds in children and <0.08 seconds in infants
- Tall P waves(P pulmonale): indicates right atrial dilatation
- Prolonged/wide/bifid P waves (P mitrale): indicates left atrial dilatation
Q wave
- Normal duration 0.02-0.03 seconds
- Normal amplitude
<5 mm
- Abnormal if present in V1 or absent in V5 or V6
- Abnormally deep may indicate ventricular hypertrophy. Look for “dagger” Q waves in leads I, aVL and V5-6, often seen in hypertrophic cardiomyopathy
- Abnormally deep and wide may indicate myocardial infarction or fibrosis
QRS complex
- The QRS complex represents ventricular depolarisation and consists of a Q, R and S wave
- Measured in lead II from onset of Q wave to termination of S wave
QRS duration
- Duration of >0.12 seconds/3 small squares is considered pathological in children
- Bundle branch block (BBB): wide QRS complex and interruption of flow of R/S waves
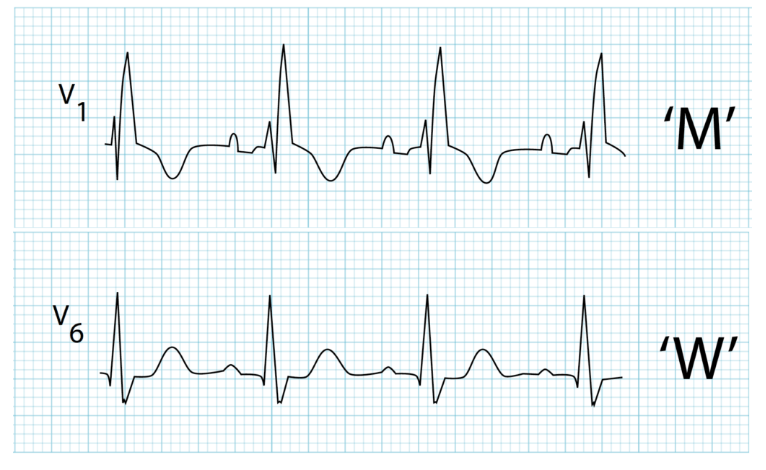
- BBB is best interpreted in leads V1 and V6 using the mnemonic ‘William Morrow’
- The first and last letter of each word relate to the deflection of the QRS complex in leads V1 and V6 respectively. The ‘W’ representing negative deflection and the ‘M’ positive deflection
- ‘William’ describes the pattern for left bundle branch block and ‘Morrow’ right bundle branch block
- Partial BBB (without QRS prolongation) is considered a normal finding
- Left BBB (LBBB): negative QRS in V1 and positive deflection in V6. Rare in children who have not had cardiac surgery and is commonly seen after surgical LVOT resection (eg myotomy or myectomy)
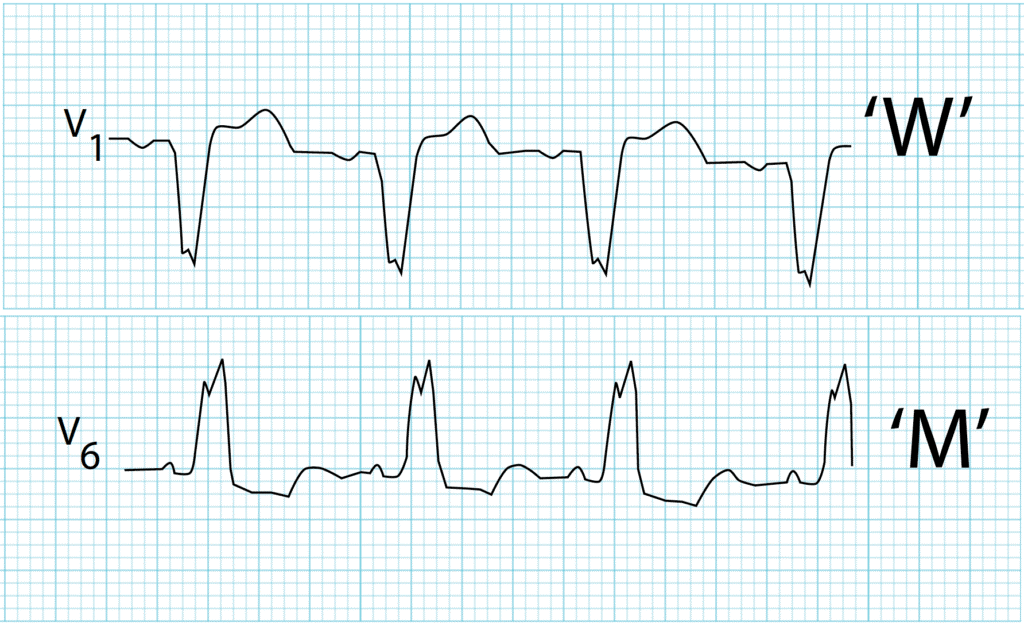
- Right BBB (RBBB): positive deflection or rSR pattern in V1 with negative deflection in V6. May be caused by right ventricular overload (commonly secundum ASD or rarely with Ebstein anomaly). Dominant R’ (with the apostrophe indicating a taller second R wave). RBBB can commonly be seen after ventricular septal defect (VSD) or tetralogy of Fallot repair
QRS amplitude
- See Additional notes for normal R and S voltages for age
- High QRS amplitudes are seen in
- Ventricular hypertrophy (see below)
- Ventricular conduction disturbances eg BBB, WPW
- Low QRS amplitudes are seen in
ST segment
- Interval between ventricular depolarisation and repolarisation
- Begins at end of S wave (J point) and terminates at beginning of T wave
- Isoelectric in a normal ECG
- Elevation or depression up to 1 mm in limb leads may be normal in infants and children
- Elevation or depression up to 2 mm in precordial leads is considered normal. A shift above 2mm should be considered pathological (see below)
Normal variants:
- J-point depression: the J point is depressed without sustained ST depression, ie upsloping ST depression
- Benign early repolarisation is a common finding in adolescents. ST segment is elevated and concave in leads with an upright T wave
Pathological variants:
- Coved or saddle-back ST elevation in V1-3 over 2 mm could be a sign for Brugada syndrome
- Sustained horizontal ST segment depression ≥0.08 sec is abnormal
- Pathological ST segment changes are commonly associated with T wave changes and occur in pericarditis, myocardial ischaemia or infarction, severe ventricular hypertrophy (ventricular strain pattern) and digitalis effect


|

|
|
Brugada type 1
(coved ST elevation)
|
Brugada type 2
(saddle-back ST elevation)
|
T waves
- Represent repolarisation of the ventricles
- Upright T waves in V1 in children between 4 days and 4 years of age are usually pathological and indicative of RVH
- There is a physiological inversion in V1-V3 after birth which becomes upright (V3 first, followed by V2 and V1) during childhood (by 16 years of age in majority of children)
- Depending on age of child, T waves in V1-V3 may not have reversed, and this can be a normal variant (‘persistent juvenile T wave pattern’)
- Persistent inversion of T wave in V1 is a normal variant
- Should be upright in leads V5 and V6 in a normal ECG
- Tall, peaked T waves: hyperkalaemia, LVH (volume overload), cerebral vascular accident, posterior myocardial infarct
- Flat or low T waves: normal in newborns,
hypokalaemia,
hypoglycaemia or hyperglycaemia, hypothyroidism, myocarditis, pericarditis, ischaemia, digitalis toxicity, Long QT syndrome
U waves
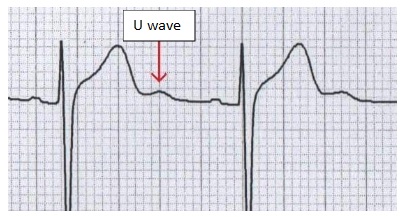
- U Waves are the extra positive deflection at the end of a T wave
- Normal finding at slower heart rates (eg sinus bradycardia)
- Also caused by
hypokalaemia
U wave indicated by red arrow below.
Intervals
PR interval
- Measured from start of P wave to beginning of QRS complex in lead I
- Varies according to heart rate and age (see Additional notes)
- Normal range is 110-200 msec or 5 small squares
- Prolonged PR interval: indicates 1st degree heart block. This frequently represents a normal variant, however, first degree AV block is also seen in myocarditis, drug toxicities, congenital heart disease (Ebstein anomaly, ASD),
hyperkalaemia, and ischaemia
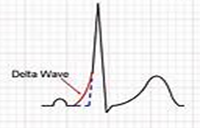
- Short PR interval: Can be a normal variant, may also be seen in WPW and glycogen storage disease (eg Pompe disease). If there is a short PR interval, QRS complex should be checked for presence of a delta wave indicating WPW (see example below)
QT interval
- Detecting prolongation of QT interval is important in the identification of children at risk of life-threatening arrhythmias associated with syncope and sudden death
- Measured from beginning of Q wave to end of T wave, usually in leads II and V5
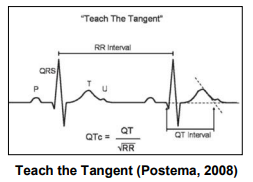
- There is variance with heart rate, and it may be corrected (QTc) using Bazett’s formula (QTc = QT ⁄ √R-R interval)
- The “tangent” method can be used to help identify the end of the T wave
- A tangent is drawn to the steepest slope of the last limb of the T wave in lead II. The end of the T wave is the intersection of the tangent with the baseline
- Manual QTc should be >340 ms and ≤450 ms
- QTc prolongation:electrolyte abnormalities (especially hypocalcemia/hyperventilation) head injury/concussion, drugs (eg amiodarone,
tricyclics, fluconazole, erythromycin, methadone, metoclopramide, haloperidol, ondansetron,
SSRIs, long QT syndrome or rarely myocarditis.
- QT and subsequently QTc are also prolonged when QRS is prolonged (eg RBBB), after frequent ectopic beats or ventricular pacing,
supraventricular tachycardia or VT or recent catheter ablation
- If there is any reason to suspect long QT syndrome, discuss with Cardiologist
Ventricular hypertrophy
- Ventricular hypertrophy produces changes in one or more of the following areas: QRS axis, QRS voltages, Q waves, R/S ratio and/or T axis
- Normal values for age can be found in Additional notes
- Mildly elevated voltages in precordial leads are a frequent normal variant
Right Ventricular Hypertrophy
| Axis
|
|
|
Voltages
|
- Tall R waves (greater than limits for child’s age) in right-sided leads V4R and V1
- Deep S waves (greater than limits for child’s age) in left-sided leads V5 and V6
|
|
R/S Ratio
|
- Abnormal R/S ratio in favour of RVH
- Increased R/S ratio (greater than upper limits for child’s age) in V1-2
- R/S ratio
<1 in V6 (after one month of age)
|
|
Abnormal T waves
|
- Upright T waves in V1 and V4R in children 3 days to 6 years (provided if T waves are normal elsewhere, ie
upright in V6). This alone is evidence of significant RVH
|
|
Abnormal Q waves
|
- qR pattern in V1 (small Q wave, tall R wave) is highly specific for RVH
|
Left Ventricular Hypertrophy
| Axis
|
- LAD for child’s age (marked LAD is rare with LVH)
|
|
Voltages
|
- Tall R waves in left-sided leads V5 and V6 (greater than limits for child’s age)
- Deep S waves in right-sided leads V4R and V1 (greater than limits for child’s age)
|
|
R/S Ratio
|
- Abnormal R/S ratio in favour of LV
- Decreased R/S ratio in V1-2 (less than upper limits for child’s age)
|
|
Abnormal T waves
|
- In I and aVL (LV strain pattern)
|
|
Abnormal Q waves
|
|
Biventricular hypertrophy
- Positive voltage criteria for RVH and LVH (with normal QRS duration)
- Positive voltage criteria for RVH or LVH and relatively large voltages for other ventricle
- Large equiphasic QRS complexes in 2 or more limb leads and in mid-precordial leads (V2-5)
Conditions associated with ECG changes
Wolff-Parkinson-White Syndrome
- Short PR interval for age
- Delta wave (initial slurring of the QRS complex), best seen in V2-V6
- Wide QRS complex
Pericarditis, myocarditis and syncope
Pericarditis
|

- Stage 1 Widespread ST elevation and PR depression with reciprocal changes in aVR (first two weeks)
- Stage 2 Normalisation of ST changes; generalised T wave flattening (1-3 weeks)
- Stage 3 Flattened T waves become inverted (3 to several weeks)
- Stage 4 ECG returns to normal (several weeks onwards)
|
|
Myocarditis
|
- Increased PR interval
- Decreased T wave amplitude
- Increased QT interval
- Decreased QRS amplitude
|
|
Syncope
|
- Long QT
- Wide complex tachycardia
- Hypertrophic obstructive cardiomyopathy (LVH and pathological Q waves)
|
Electrolyte disturbances
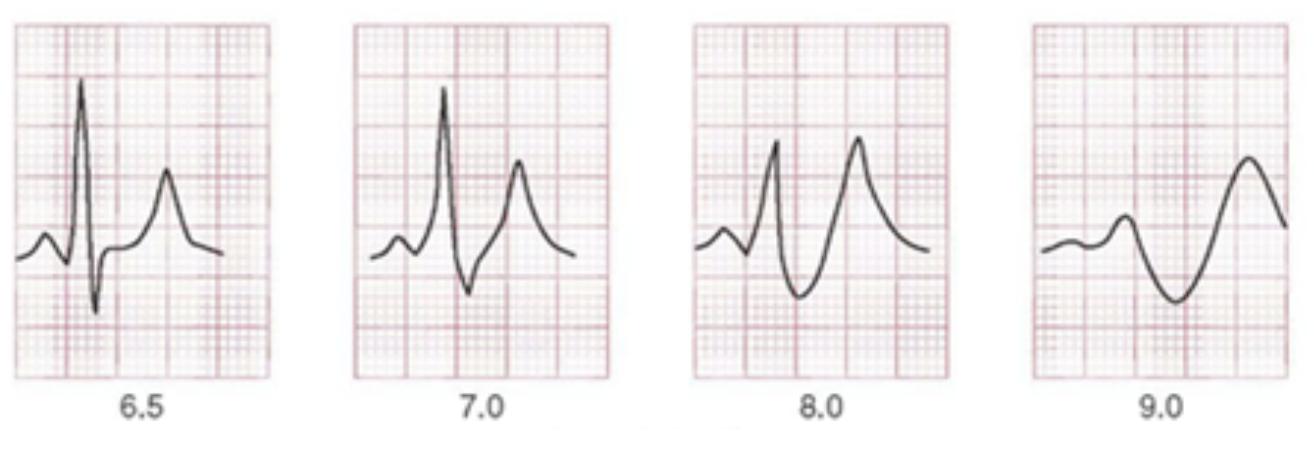
Hyperkalaemia
|
- P wave widening or flattening
- PR prolongation
- Widening of QRS
- Peaked T waves
- Bradyarrhythmias (sinus bradycardia, high-grade AV block with slow junctional and ventricular escape rhythms, slow atrial fibrillation)
- Conduction blocks (BBB, fascicular blocks)
Severe hyperkalaemia
- Development of sine wave appearance (pre-terminal rhythm)
- Ventricular fibrillation
- Pulseless electrical activity (PEA)
|
|
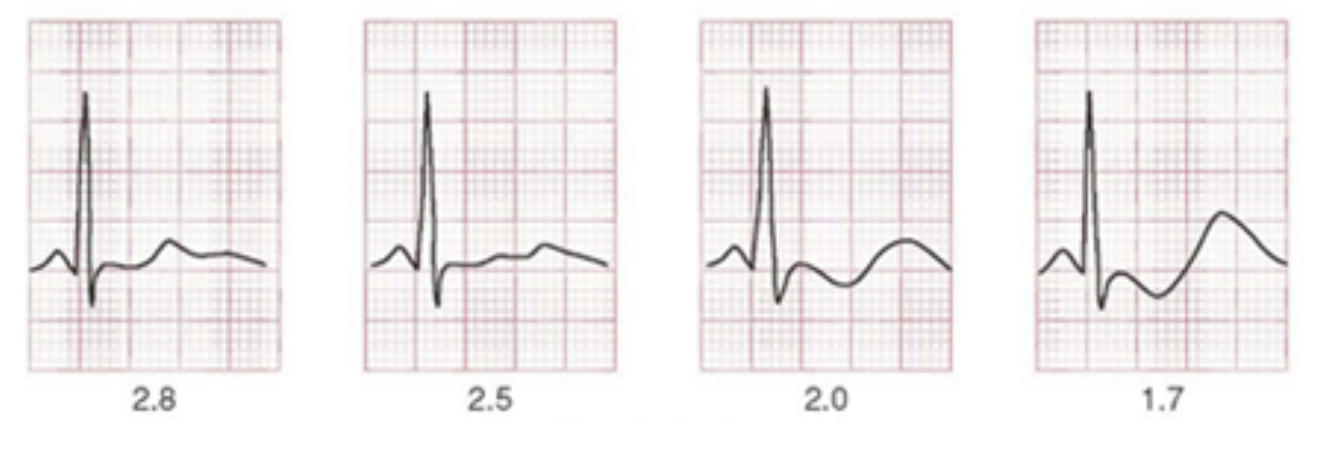
Hypokalaemia
|
- Flattened or inverted T waves
- ST depression
|
|
Hypercalcaemia
|

|
|
Hypocalcaemia
|
- Prolonged QT interval
- Dysrhythmias are uncommon, although atrial fibrillation has been reported
- Torsades de pointes may occur, but is much less common than with
hypokalaemia or hypomagnesaemia
|
Consider consultation with local paediatric team when
- Cardiac ‘red flags’ present
- Abnormal cardiac examination
- Abnormalities on ECG
Contact local cardiology team when
- Long QT syndrome is suspected
Consider transfer when
- Child is requiring care beyond the comfort level of the facility
For advice about acutely unwell transfers requiring PICU or neonatal retrievals see
Retrieval Services
Additional Notes
ECG lead placement
Heart rate according to age
| Age
|
Mean heart rate (beats/min)
|
Heart rate range (beats/min)
|
|
Newborn
|
145
|
120-170
|
|
6 months
|
145
|
110-170
|
|
1 year
|
132
|
105-150
|
|
2 years
|
120
|
95-150
|
|
4 years
|
108
|
80-150
|
|
6 years
|
100
|
75-140
|
|
10 years
|
90
|
60-130
|
|
14+ years
|
85
|
60-115
|
QRS Axis according to age
| Age
|
QRS axis
|
|
1 week to 1 month
|
+110 (+30 to +180)
|
|
1 to 3 months
|
+70 (+10 to +125)
|
|
3 months to 3 years
|
+60 (+10 to +110)
|
|
Older than 3 years
|
+60 (+20 to +120)
|
|
Adults
|
+50 (-30 to +105)
|
PR interval according to heart rate and age
Mean (and upper limit of normal)
| Rate
|
0-1 month
|
1-6 months
|
6-12 months
|
1-3 years
|
3-8 years
|
8-12 years
|
12-16 years
|
Adult
|
|
<60
|
|
|
|
|
|
0.16 (0.18)
|
0.16 (0.19)
|
0.17 (0.21)
|
|
60-80
|
|
|
|
|
0.15 (0.17)
|
0.15 (0.17)
|
0.15 (0.18)
|
0.16 (0.21)
|
|
80-100
|
0.10 (0.12)
|
|
|
|
0.14 (0.16)
|
0.15 (0.16)
|
0.15 (0.17)
|
0.15 (0.20)
|
|
100-120
|
0.10 (0.12)
|
|
|
(0.15)
|
0.13 (0.16)
|
0.14 (0.15)
|
0.15 (0.16)
|
0.15 (0.19)
|
|
120-140
|
0.10 (0.11)
|
0.11 (0.14)
|
0.11 (0.14)
|
0.12 (0.14)
|
0.13 (0.15)
|
0.14 (0.15)
|
|
0.15 (0.18)
|
|
140-160
|
0.09 (0.11)
|
0.10 (0.13)
|
0.11 (0.13)
|
0.11 (0.14)
|
0.12 (0.14)
|
|
|
(0.17)
|
|
160-180
|
0.10 (0.11)
|
0.10 (0.12)
|
0.10 (0.12)
|
0.10 (0.12)
|
|
|
|
|
|
>180
|
0.09
|
0.09 (0.11)
|
0.10 (0.11)
|
|
|
|
|
|
QRS duration according to age
Mean (and upper limit of normal*)
|
|
0-1 month
|
1-6 months
|
6-12 months
|
1-3 years
|
3-8 years
|
8-12 years
|
12-16 years
|
Adult
|
|
Seconds
|
0.05 (0.07)
|
0.055 (0.075)
|
0.055 (0.075)
|
0.055 (0.075)
|
0.06 (0.075)
|
0.06 (0.085)
|
0.07 (0.085)
|
0.08 (0.10)
|
*Upper limit of normal refers to the 98th percentile
R and S voltages according to lead and age
Mean (and upper limit of normal*)
|
|
Lead
|
0-1 months
|
1-6 months
|
6-12 months
|
1-3 years
|
3-8 years
|
8-12 years
|
12-16 years
|
Young adults
|
|
R Voltage
|
I
|
4 (8)
|
7 (13)
|
8 (16)
|
8 (16)
|
7 (15)
|
7 (15)
|
6 (13)
|
6 (13)
|
|
II
|
6 (14)
|
13 (24)
|
13 (27)
|
13 (23)
|
13 (22)
|
14 (24)
|
14 (24)
|
9 (25)
|
|
III
|
8 (16)
|
9 (20)
|
9 (20)
|
9 (20)
|
9 (20)
|
9 (24)
|
9 (24)
|
6 (22)
|
|
aVR
|
3 (8)
|
2 (6)
|
2 (6)
|
2 (5)
|
2 (4)
|
1 (4)
|
1 (4)
|
1 (4)
|
|
AVL
|
2 (7)
|
4 (8)
|
5 (10)
|
5 (10)
|
3 (10)
|
3 (10)
|
3 (12)
|
3 (9)
|
|
aVF
|
7 (14)
|
10 (20)
|
10 (16)
|
8 (20)
|
10 (19)
|
10 (20)
|
11 (21)
|
5 (23)
|
|
V4R
|
6 (12)
|
5 (10)
|
4 (8)
|
4 (8)
|
3 (8)
|
3 (7)
|
3 (7)
|
|
|
V1
|
13 (24)
|
10 (19)
|
10 (20)
|
9 (18)
|
8 (16)
|
5 (12)
|
4 (10)
|
3 (14)
|
|
V2
|
18 (30)
|
20 (31)
|
22 (32)
|
19 (28)
|
15 (25)
|
12 (20)
|
10 (19)
|
6 (21)
|
|
V5
|
12 (23)
|
20 (33)
|
20 (31)
|
20 (32)
|
23 (38)
|
26 (39)
|
21 (35)
|
12 (33)
|
|
V6
|
5 (15)
|
13 (22)
|
13 (23)
|
13 (23)
|
15 (26)
|
17 (26)
|
14 (22)
|
10 (21)
|
|
S Voltage
|
I
|
5 (10)
|
4 (9)
|
4 (9)
|
3 (8)
|
2 (8)
|
2 (8)
|
2 (8)
|
1 (6)
|
|
V4R
|
4 (9)
|
4 (12)
|
5 (12)
|
5 (12)
|
5 (14)
|
6 (20)
|
6 (20)
|
|
|
V1
|
7 (18)
|
5 (15)
|
7 (18)
|
8 (21)
|
11 (23)
|
12 (25)
|
11(22)
|
10 (23)
|
|
V2
|
18(35)
|
15 (26)
|
16 (29)
|
18 (30)
|
20 (33)
|
21 (36)
|
18 (33)
|
14 (36)
|
|
V5
|
9 (17)
|
7 (16)
|
6 (15)
|
5 (12)
|
4 (10)
|
3 (8)
|
3 (8)
|
|
|
V6
|
3 (10)
|
3 (9)
|
2 (7)
|
2 (7)
|
2 (5)
|
1 (4)
|
1 (4)
|
1 (13)
|
* Voltages are measured in millimeters, when 1 mV = 10 mm paper. Upper limit of normal refers to 98th percentile
R/S Ratio according to age
Mean, LLN*, and ULN*
| Lead
|
|
0-1 months
|
1-6 months
|
6-12 months
|
1-3 years
|
3-8 years
|
8-12 years
|
12-16 years
|
Adults
|
|
V1
|
LLN
|
0.5
|
0.3
|
0.3
|
0.5
|
0.1
|
0.15
|
0.1
|
0.0
|
|
Mean
|
1.5
|
1.5
|
1.2
|
0.8
|
0.65
|
0.5
|
0.3
|
0.3
|
|
ULN
|
19
|
S=0
|
6
|
4
|
2
|
1
|
1
|
1
|
|
V2
|
LLN
|
0.3
|
0.3
|
0.3
|
0.3
|
0.05
|
0.1
|
0.1
|
0.1
|
|
Mean
|
1
|
1.2
|
1
|
0.8
|
0.5
|
0.5
|
0.5
|
0.2
|
|
ULN
|
3
|
4
|
4
|
1.5
|
1.5
|
1.2
|
1.2
|
2.5
|
|
V6
|
LLN
|
0.1
|
1.5
|
2
|
3
|
2.5
|
4
|
2.5
|
2.5
|
|
Mean
|
2
|
4
|
6
|
20
|
20
|
20
|
10
|
9
|
|
ULN
|
S=0
|
S=0
|
S=0
|
S=0
|
S=0
|
S=0
|
S=0
|
S=0
|
*LLN, Lower limit of normal; ULN, upper limit of normal
Q Voltages according to lead and age
Mean (and upper limit of normal*)
| Lead
|
0-1 months
|
1-6 months
|
6-12 months
|
1-3 years
|
3-8 years
|
8-12 years
|
12-16 years
|
Adult
|
|
III
|
1.5 (5.5)
|
1.5 (6)
|
2.1 (6)
|
1.5 (5)
|
1.0 (3.5)
|
0.6 (3)
|
1.0 (3)
|
0.5 (4)
|
|
aVF
|
1.0 (3.5)
|
1.0 (3.5)
|
1.0 (3.5)
|
1.0 (3)
|
0.5 (3)
|
0.5 (2.5)
|
0.5 (2)
|
0.5 (2)
|
|
V5
|
0.1 (3.5)
|
0.1 (3)
|
0.1 (3)
|
0.5 (4.5)
|
1.0 (5.5)
|
1.0 (3)
|
0.5 (3)
|
0.5 (3.5)
|
|
V6
|
0.5 (3)
|
0.5 (3)
|
0.5 (3)
|
0.5 (3)
|
1.0 (3.5)
|
0.5 (3)
|
0.5 (3)
|
0.5 (3)
|
Voltages are measured in millimeters, when 1 mV = 10 mm paper.
*Upper limit of normal or 98th percentile
Additional Resources
APLS algorithms
Acceptable Ranges for Physiological Variables
Last updated September 2023